
airrow's Link

I don't see any horse-beating, though... just a basic explanation of the situation, and overall, pretty refreshing as hunting-related journalism goes...
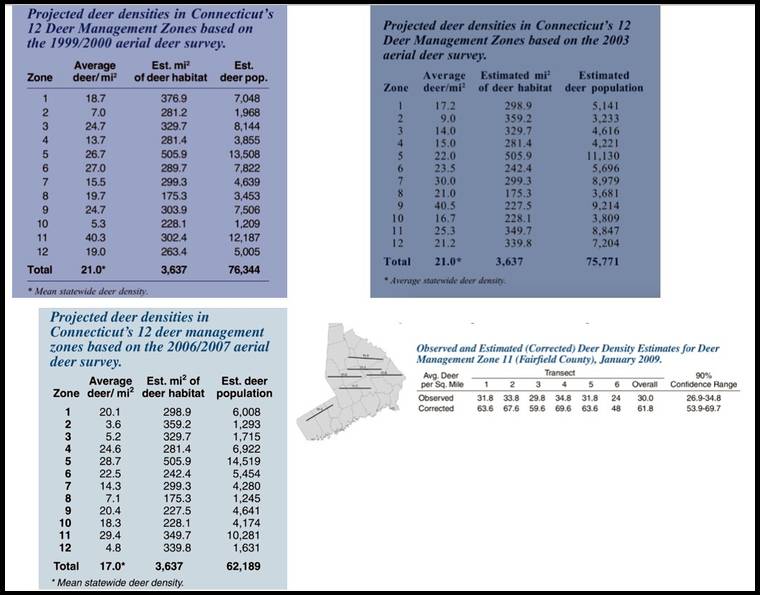
Example of a decreased Zonal area: Looking at the DEP aerial survey from 1999/2000, you see a shell game being played with the zonal square miles, Zone 11 is stated as being 302.4 square miles in size when in reality it is 625 square miles, a 51.6% difference. If we correct for this error DEP`s count of 40.3 dpsm becomes 19.8 dpsm. Zone 12 is stated as being 263.4 square miles in size and is 566.3 square miles, a 53.48% difference. If we correct for this error DEP`s count of 19 dpsm becomes 8.84 dpsm. Both Zones 11 & 12 have been the targets of whitetail destruction by the DEEP for the last 10+ years based on this manipulated data.
Example of an increased Zonal area: Zone 1 shows 18.7 dpsm and a zonal area of 376.9 square miles; if we adjust for the actual square miles for zone 1 which is 345.3 the deer count increases to 20.41 dpsm.


It's quite a stretch to go from that number to "about 120,000". It's not like we're talking about a small difference in the numbers; 76,344 to 120,000; not even remotely close to each other.
Consider the number of deer killed by motor vehicles too; 3,098 with 76,344 deer in 2000 and the DEEP estimates the herd is "down" to 100,000 deer in 2015 yet only 749 deer were killed by motor vehicles? Even if we didn't have the kind of increase in motor vehicle traffic we do those numbers wouldn't make sense.
The DEEP is asking residents to believe that the deer herd increased by 24% while deer killed by motor vehicles decreased by 76%? Seriously? Hunters are told they underestimate deer numbers because they miss deer that they can't see but are there; it looks like getting in car makes even more deer disappear from view....
It's getting easier by the day to understand how CT came to be the colossal mess that it is today.
Interesting info.... Is it possible that the DEEP changed the way that they add up the acreage? I'd think that if they were to subtract acres of pavement, roofs, lawns, water....That should cut the estimate from acres of land mass to acres of "usable" habitat, which A) would definitely be a smaller number and B) is what they really ought to be thinking about anyway.
Otherwise... they have data going back to the beginning regarding hunting success as it relates to mast, so if this was an exceptional year, you would naturally expect an exceptionally low harvest total. Especially with the herd undeniably reduced in the past 15 years.
As far as population estimates go, though... On the one hand, if you have a bunch of data and you discover an error in your methodology for converting raw into finished (flawed estimation technique), you can always go back and re-run the numbers, so long as your counting method doesn't change and you are only tweaking your correction factor, so to speak. Or if you change counting & estimating techniques to something that you believe to be more accurate, you can really only go off of the new numbers. So publishing a higher number does not mean that the population is believed to be any higher than it used to be, it just means that whatever the population used to be, the NEW estimate is a higher number (and so it stands to reason that the population used to be higher than it was estimated to be back then).
I know is sounds like double-talk, but it's not.
Of course, I'm assuming that the estimation technique has in fact changed and that the numbers are NOT comparable; you are not drawing that distinction, and honestly I have no idea whether you actually need to.
So looking at Mike's 75% reduction in roadkill (assuming no changes in the way that THOSE numbers were generated)... That doesn't tell me that the statewide herd is down 75%, it just means that the herd is most reduced where there are the most roads and vehicles.
But I am absolutely certain that the overall population has come down markedly, at least where I've been out up in Ridgefield. And to be honest, I think it has a ways to go, because the vegetation is still hammered right down to the ground....

" I'd think that if they were to subtract acres of pavement, roofs, lawns, water....That should cut the estimate from acres of land mass to acres of "usable" habitat, which A) would definitely be a smaller number and B) is what they really ought to be thinking about anyway. "
Roads, building and pavement make up approximately 15% of a town. Interesting comment but water has been excluded from the land mass figure 4,845 square miles. Deer cross roads, parking lots and yes they do actually frequent lawns from time to time..
By using a zonal area 1/2 the actual size the DEP is essentially using their 2X factor on the number of deer seen; the problem is they are calling the numbers "mean statewide density" or raw data and not adjusted. This is essentially showing 2X or twice the number of deer that we actually have in Connecticut and has led us to were we are today.
In 2009 the CT. DEP decided to concentrate on Zone 11 (Fairfield County) with a new type of transect survey and no longer did statewide surveys. Lets compare years 2007 (old style survey) to the year 2009 (new style survey); in 2007 the Zone 11 survey stated 29.4 dpsm or 16.44 dpsm (corrected for zone size / 625 sm). By using a zonal area 1/2 the actual size the DEP is essentially using their 2X factor on the number of deer seen.
In 2009, (two years later) the same Zone 11 was stated as having an average 30.0 dpsm or 61.8 dpsm corrected; so by the DEP`s own numbers, from 2007 to 2009 the deer herd in Fairfield County, CT grew by either 2X or 4X (corrected).
This gave the DEP everything they needed (on paper) to convince an unsuspecting public of a Lyme disease epidemic or an out of control deer population. Going from 16.44 dpsm ( zone 11) raw count to 61.8 dpsm corrected with an 90% confidence range in just two years.
Lots to digest there and I will come back to it when I'm not trying to watch a hockey game at the same time! (Longbeard will undestand!)