
It's probably impossible to get a true apples-to-apples comparison of each of CT's 12 DMZ's (Deer Management Zones) but it is interesting to take a look at one statistic that might make you want to reconsider whether it's worth the trek down to Zone 11 or 12; deer harvest per square mile.
Each year as you know the CT DEEP publishes a deer harvest report. It is very easy to take this data, compile a total hunting take for each zone and then divide that number by the square miles in that zone, arriving at a harvest / square mile figure.
It should go without saying that a lot of factors may factor in; differences in habitat, number of hunters, etc. but it's a viable option for taking a snapshot of potential success in any given zone.
Here is the breakdown for 2016 for your review:
Connecticut's Best Deer Hunting Areas in 2016 - Harvest results for 2016 are a good indicator of where you should look to hunt in 2017. Data shows Connecticut Zones 1-12; deer per square mile harvested (DPSMH) per zone in 2016 - (9/15/2016-12/31/2016).
1 - Zone 4B - 3.500 dpsmh - (Sunday hunting allowed)
2 - Zone 5 - 2.883 dpsmh - (Sunday hunting allowed)
3 - Zone 9 - 2.852 dpsmh - (Sunday hunting allowed)
4 - Zone 8 - 2.839 dpsmh - (Sunday hunting allowed)
5 - Zone 10 - 2.713 dpsmh - (Sunday hunting allowed)
6 - Zone 11 - 2.435 dpsmh - (Baiting, unlimited tags, Sunday hunting and January hunting allowed)
7 - Zone 12 - 2.130 dpsmh - (Baiting, unlimited tags, Sunday hunting and January hunting allowed)
8 - Zone 4A - 2.085 dpsmh - (No Sunday hunting, baiting, or January season allowed)
9 - Zone 1 - 2.055 dpsmh - (Sunday hunting allowed)
10- Zone 6 - 1.940 dpsmh - (Sunday hunting allowed)
11- Zone 7 - 1.930 dpsmh - (Sunday hunting allowed)
12- Zone 3 - 1.390 dpsmh - (No Sunday hunting, baiting, or January season allowed)
13- Zone 2 - 1.168 dpsmh - (No Sunday hunting, baiting, or January season allowed)


I thought you said baiting should be stopped because of the devastating number of deer killed and ALL the access to properties?
They came 6 and 7 according get to this post.
1 As indicated in the OP it's "probably Impossible" to get a true apples-to-apples comparison for each zone. It should go without saying that anytime this type of caveat is applied the statement(s) to follow should be taken with the proverbial grain of salt.
2. There isn't any doubt that the numbers are skewed lower for Zones 11 & 12 but I wouldn't characterize them as "especially skewed"; if you take the square mileage for example of Greenwich, Stamford, Norwalk, Fairfield and Bridgeport (the bulk of the concrete jungle) you account for approximately 33% of the total land in Fairfield County (FFC is 827 square miles but 202 of those are water so the land total is 625 square miles).
It should go without saying that every inch of those towns isn't paved and when I've made inquires as to an estimate of what % of FFC is "paved" I've gotten numbers ranging from 6-15%. The former seems low to me, the latter is probably closer to reality. From here it's fairly simple to factor in the difference for either range, and since I think the higher one is more realistic you'd add 15% to the total for Zone 11.
Land lost to paving would need to be applied to every other zone and outside of New Haven and Hartford counties (and southern Litchfield County) the factor would likely be lower, yet still require accounting for.
3. The above should illustrate why it's pointless to get worked up over numbers best taken with a gain of salt-too much involved for what really appears to be intended as another way of assessing hunting potential.
4. 2.6/7 is .3714 or 37.1%; not sure where the 62% came from and if I recall correctly the 7 was 7.34 and was from the privately funded FLIR of one town and I really can't believe anyone wants to revisit that discussion.
For those of you who head out west for elk you might have gotten more out of this exercise; I'm sure many of you also look at success rates before applying for a zone (given the cost of an elk hunt it makes sense). Ditto for those applying for permits in midwest states for whitetail deer. Anything that tilts the odds even slightly in your favor is a good idea.
Yep, definitely the off-season......
2. OK so not "especially skewed", but we agree they are skewed low. Zones 11 & 12 would move up that list.
3. Not getting worked up over numbers, these number will not get anyone from Zone 11 to rush to Zone 4B or 9 to see what’s going on. It may work for northern New England or the Midwest, but not much for hunter potential in CT in my opinion. That being said, I agree it is there to use as a tool for anyone who wants to use it.
4. It’s not about revisiting a discussion. We just ended the season and the OP just posted some numbers that correlate to this past season, so now it comes back full circle from the discussions of single to low double digit numbers. My point is that the harvest data proves what many here have said, deer densities are higher than what we were fed prior to the season. Anyone that has hunted in areas or states with single to low double digit densities, would know that this is not the case here. There is a reason why many from Massachusetts travel far to hunt in Zone 11 or CT for that matter.
Yep, definitely the off-season......and the OP is doing the same thing, evaluating the data that just came in from this past season which is typically when data is evaluated.
Not looking for a pissing match, just posting my opinion on a hunting forum. We all have many things in common and that is the love of this sport and the health of our deer herd. We can all agree that numbers are way down from several years past. I don’t post often so I’ll crawl back under my rock now:) Have a great 2017 season to all.
From what I've read on this site, FF county is backyard/small parcel hunting and Mass seems to be more open woods, like the state land in CT (not sure, but it feels that way from comments). My point being, the perspective of the Mass hunters is there are more deer, but could it be they're just pushed onto small tracks of land?


Bob. Because you have 8 deer in a pen does not mean that is single digit deer densities, unless of course the pen has an area of one square mile, then you would have 8 deer/square mile. If you have 8 deer in 0.5 square mile pen, you would have the equivalent of 16 deer/square mile. If the pen is a 0.25 of a square mile, you would have 32 deer/square mile. And there are more deer in Zone 11 than in western MA. Like Toby said, otherwise, why would they waste so much money in fuel and non-resident license fees to drive 2 hours to go deer hunting?
Perception plays a big part in the comments is what I'm driving at. If I don't see any deer hunting in Mass but when I come to CT I see 1 or 2 every other hunt that's a great place to hunt. But to the CT hunters in the same area it's terrible because they once say 8-10 per day. It's the less or more comparison that I stated in an earlier thread. Ct guys are seeing less = bad, but the Ma guys are seeing more = good. Same number of deer, different point of view.

By using a zonal area 1/2 the actual size the DEP is essentially using their 2X factor on the number of deer seen; the problem is they are calling the numbers "mean statewide density" or raw data and not adjusted. This is essentially showing 2X or twice the number of deer that we actually have in Connecticut and has led us to were we are today.
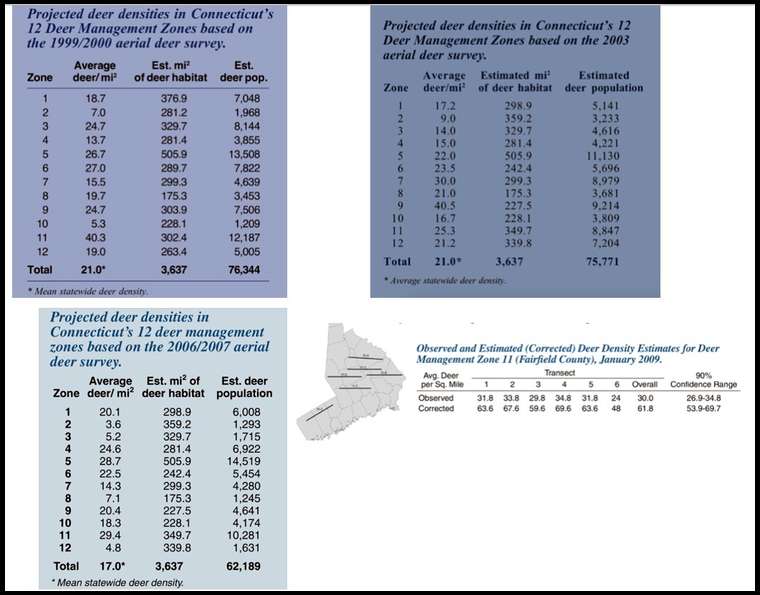
2007 was the last year the CT DEP did Statewide aerial surveys estimates in Connecticut, The DEP stated that in 2007 the "mean statewide deer density", averaged 17 dpsm; if we correct the actual zonal square miles in Connecticut 4,845, the number 17 dpsm becomes 12.80 dpsm or 62,189 deer statewide. And in 2016 we have the CT DEEP stating we now have 100,000 deer or 20.63 dpsm in Connecticut, a 60.80% increase from 2007.
In 2009 the CT. DEP decided to concentrate on Zone 11 (Fairfield County) with a new type of transect survey and no longer did statewide surveys. Lets compare years 2007 (old style survey) to the year 2009 (new style survey); in 2007 the Zone 11 survey stated 29.4 dpsm or 16.45 dpsm (corrected for zone size / 625 sm). By using a zonal area 1/2 the actual size the DEP is essentially using their 2X factor on the number of deer seen.
In 2009, (two years later) the same Zone 11 was stated as having an average 30.0 dpsm or 61.8 dpsm corrected; so by the DEP`s own numbers, from 2007 to 2009 the deer herd in Fairfield County, CT grew by either 2X or 4X (corrected).
This gave the CT DEEP everything they needed (on paper) to convince an unsuspecting public of a Lyme disease epidemic or an out of control deer population. Going from 16.45 dpsm ( zone 11) raw count to 61.8 dpsm corrected with an 90% confidence range in just two years.
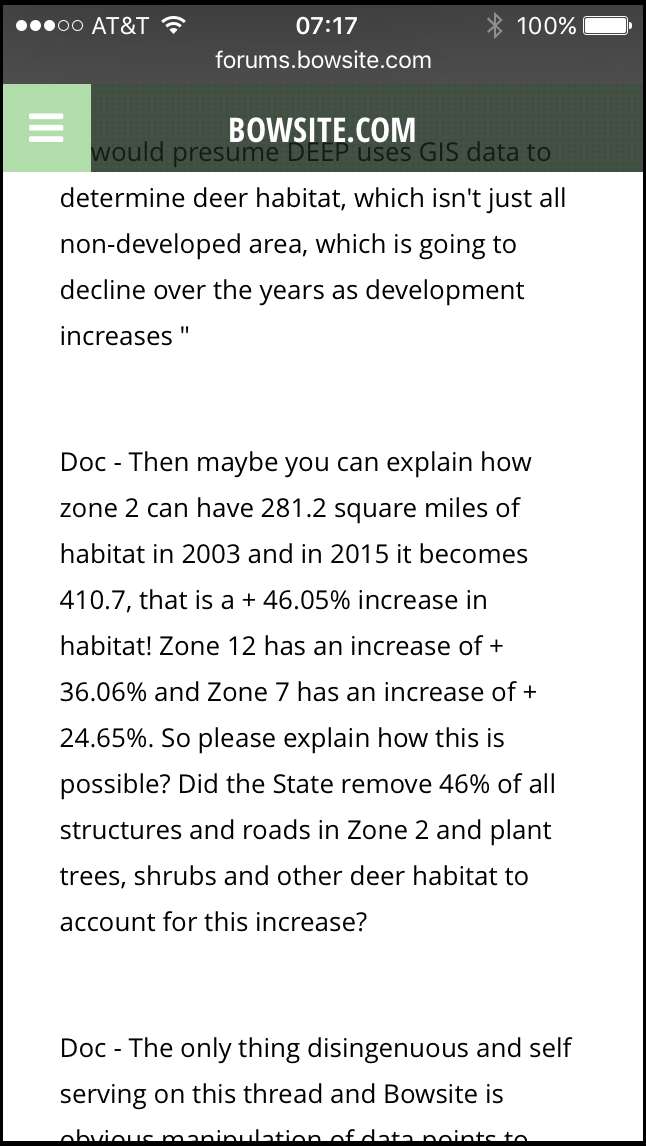
" I would presume DEEP uses GIS data to determine deer habitat, which isn't just all non-developed area, which is going to decline over the years as development increases "
Doc - Then maybe you can explain how zone 2 can have 281.2 square miles of habitat in 2000 and in 2015 it becomes 410.7, that is a + 46.05% increase in habitat! Zone 12 has an increase of + 36.06% and Zone 7 has an increase of + 24.65%. So please explain how this is possible? Did the State remove 46% of all structures and roads in Zone 2 and plant trees, shrubs and other deer habitat to account for this increase?
Doc - The only thing disingenuous and self serving on this thread and Bowsite is obvious manipulation of data points to achieve a desired outcome.
As far as how DEEP calculates deer habitat, I don’t know. There is a lot of state forest and MDC lands in Zone 2 and maybe they scaled back logging during that time as wood prices tanked and trees grew back. I don’t know. Zone 12 had that increase because Lyme and East Haddam were added at some point as Zone 12 used to just hug the Shoreline towns. Zone 7, I don’t know. But again, if the area of deer habitat is increased, then that dilutes the density of deer taken in that zone. So that kind of makes no sense in your vast conspiracy that DEEP is trying to make it appear as if there are more deer. If that were the case, they would shrink the amount of deer habitat to make the density of deer taken appear to increase, like you corrected me to do....


Thought this was interesting. 2015 article with data from 2014 season, if I read it correctly. Traffic accident data might be another way to assess things. As Connecticut scrambles to look under the couch cushions with the hope of finding 1.4 billion dollars to balance the budget, I doubt there will be any updated air surveys in the near future. The article mentions that deer vs car collisions in the state decreased from 15K to less than half between the early 2000's and 2014. I would think traffic volume would have increased a bit over this period, which should have increased the # of collisions (?) I doubt people's driving skills increased or the deer learned to cross roads in cross walks over this time period. Maybe the state built some fences or trimmed brush from the sides of the road.
BINGO! You don't need to apply a 2X factor to surveys anymore.....just cut the square miles in a zone by half.....presto! back to the high deer densities again!

"And even higher if we add in the 156 deer taken in Zones 11+12 in January 2016 as reported in the 2015 Deer Program Summary that you neglected to include."
Doc, I need to address this first and please try to pay attention this time; January numbers are excluded because only zones 11 and 12 have January hunting including those numbers in a deer harvest per square mile calculation that compares all zones will skew the data in favor of those 2 zones.
Second, I referred to Zone 12 as increasing, not Zone 11; again, please try to pay attention.
Lastly, I referred to shrinking zone size where there seems to be a major focus of killing more deer in Zone 11.
As for my options in 2017 - they're looking pretty exciting. I applied for the New Mexico elk draw yesterday. The odds are pretty slim to draw a tag, but boy is it fun to hunt those animals. And if that fails to happen, I may be going to IL. on a whitetail hunt. I have a new spot close to home I'm going to try in 2017 that looks to hold a few deer, along with my usual spots in the NW corner.
In October we're going back to Italy to visit as many wineries as possible in Tuscany, eat good food and relax. And last but not least, sometime around the end of the year I will be retiring from Stanley after nearly 45 years of service. Yup, 2017 is looking pretty good for me.


You are correct. I meant zone 12. I will edit my previous post to reflect that.
Fairfield County is the most densely populated and most populous county in the state, accounting for 26.4% of the state’s human population in 2015. Also, Fairfield County’s population rose by 7.4% from 2000-2015 while the entire state population grew by 5.4% during that time. So with Fairfield County’s population increasing at a faster rate than the entire state of CT, it stands to reason that there would be increased development and that deer habitat there would be reduced at a faster rate there than the rest of the state. This makes sense. A vast DEEP conspiracy does not.
Bob. It can be both. Forests are not static and neither is development. For instance, I just showed you the stats for people in Fairfield County. Windham County went from 118,434 people in 2010 to 116,573 in 2015, or a negative 1.5% population “growth”. Certainly there was little development occurring here during that time as forests kept growing and deer habitat increased. Right?


BTW - the US Census bureau shows CT lost people between 2015 and 2016, and we've been virtually flat from 2010.
Population estimates, July 1, 2016, (V2016) 3,576,452 Population estimates, July 1, 2015, (V2015) 3,590,886 Population estimates base, April 1, 2010, (V2015) 3,574,118


>>---CTCrow--->'s Link
Zones 3, 4a, 4b, 5, 8 and 11 show a loss of deer habitat of approximately 220 square miles. A loss of deer habitat will show a higher dpsm rate of deer habitat.
From 2003-2007 the DEEP used 3,637 square miles of deer habitat; after 2007 the DEEP increased the deer habitat to 3,785 square miles. This is an increase of deer habitat of approximately 148 square miles or 4%; unlikely unless structure is removed.
Here are several examples:
Doc - " Zone 11 deer habitat increased by 47 square miles and Zone 6 decreased by 47 square miles. "
This is what should happen when towns are moved out of Zone 6 and into Zone 11; a net zero effect in which gain in one equal loss in another. This doesn't explain how we now have an increase of approximately 58 square miles / 53 habitat in Zone 11 and an increase of approximately 18 square miles of habitat in Zone 6.
Doc - " Zone 2 deer habitat increased by 78 square miles and Zone 1 decreased by 78 square miles. "
This is what should happen when towns are moved out of Zone 1 and into Zone 2; a net zero effect in which gain in one equal loss in another. This doesn't explain how we now have an increase of approximately 89 square miles / 89 habitat in Zone 2 and an increase of approximately 46 square miles of habitat in Zone 1.
Doc - " Zone 12 deer habitat increased by 76 square miles and Zone 9 decreased by 76 square miles "
Again this is what should happen when towns are moved out of Zone 9 and into Zone 12; a net zero effect in which gain in one equal loss in another. This doesn't explain how we now have an increase of approximately 86 square miles / 83 habitat in Zone 12 and an increase of approximately 52 square miles of habitat in Zone 9.
My favorite is Zone 8, North Branford 25 square miles / 21 habitat moving to Zone 7, which now shows an increase in habitat of approximately 74 square miles.
This is about DEEP manipulating zonal square miles both up and down, using the term "Habitat" to vary deer population surveys within CT.
This is getting jumbled and pretty complicated now. When I was discussing town swaps in zones and changes in deer habitat, I was referring to the differences from 1999-2003 DMZ maps I presented to counter the claim it was a DEEP conspiracy to inflate deer abundance. So now when you are adding in the additional square mileage of habitat, I presume you mean from 2003 as presented to 2015? Now I don't know how DEEP determines what is deer habitat or not, but I do know it is not based on structures. For instance, Zone 11 was what, 291 square miles of deer habitat in 2015 as reported. If Zone 11 is 625 square miles of land area, does that mean that 334 square miles or 53% is structures? I don't think so. And again, if this is a vast DEEP conspiracy, why are they "creating" more deer habitat to dilute harvest/deer abundance? If they reported lesser land area, it would make it appear as if densities were increased. And trees grow and old fields revert to forests over time. Ecological succession is not static but rather a dynamic process so deer habitat is being created all the time. It doesn't require an excavator to raze a building to "create" deer habitat. Are we so far removed from nature that we think this is how it works now?
I will give you North Branford and I always remember it being in Zone 8. I will check those numbers tomorrow but am guessing it is an oversight and DEEP isn't trying to manipulate statewide deer numbers by neglecting to switch North Branford deer habitat from Zone 8 to 7. A big chunk of North Branford wasn't hunted in 2003 so that tactic wouldn't make sense for a conspiracy either.
1. Variable #1 is deer killed and a deer is a deer in all 12 DMZ's so I think we can agree that this unit of measure is equal for all 12 DMZ's.
2. Variable #2 is the second unit of measure, time. There is a perfectly valid reason for the OP using the time period of 9/15/2016-12/31/16; it's not a partial season for 10 of the 12 DMZ's (1-10) but a full season. Only 2 of the 12 DMZ's (11 and 12) extend the season into January so in order to maintain equality in this variable the unit of measure (time) must be equal for all 12 DMZ's. The validity of this should not be in dispute; I'm fairly certain no one would argue that dealing 10 players 3 cards and 2 players 4 cards produce identical hands of cards.
3. Variable #3 is the denominator in this equation; the final unit of measure which would be the zones being compared. While it's equally indisputable to state that a square mile in one DMZ is a square mile in another and use that for the unit of measure while it provides a universal constant in overall terms it is equally indisputable that not all zones are equally apportioned in terms of habitat.
This is where the debate begins and likely where there will never be universally accepted resolution. All that remains is an understanding of what constitutes "habitat" and I haven't seen anyone here advance absolute understanding of the term.
One other facet of this final variable that I've yet to see considered here is a final indisputable fact; only two of the 12 DMZ's allow baiting (11 and 12) and while it isn't provable beyond a reasonable doubt I strongly suspect this isn't factored into the square miles of habitat in either zone 11 and 12. Why do I suspect this? I suspect it for the simple fact that the amount of "artificial habitat" is unquantifiable; there is no requirement for any hunter to list whether they bait or not on the annual survey form and the DEEP lacks the resources to even begin to account for this practice.
Now I suppose it could be argued that this "artificial habitat" is irrelevant and if we're arguing about the course of year I'd agree. The problem though is we're trying to quantify a situation that doesn't exist over the span of a year but rather in a window of 3 1/2 months (in the span of 9/15/2016-12/31/2016 for clarity) of the year and in that time, as has been referenced in another thread deer can be drawn onto land they aren't on and legally harvested.
Since we are, in the end trying to obtain some comparative measurement of hunting we must include all facets of hunting, this being one of them.
Now while I'll be the first to admit this exercise (this thread) is preferable to shoveling snow or watching it melt this is the extent of my willingness to further indulge the time-sucking vortex that threads like this eventually devolve into.
I think, as I indicated in my initial post, while an interesting hypothesis (dhpsm) the numbers contained would have served all best by being taken "with the proverbial grain of salt."
This too shall pass......


Bob, to answer your question, DEEP switched up the zones in 2003 as described for management purposes. Each zone is managed as its own entire entity; portions of zones are not managed differently than other portions of that same zone. That is why zonal changes were made. Then it appears that in 2007, DEEP looked at deer habitat and found that it increased by 147 square miles from 1999 if not before. And they have been using those same 2007 numbers since. In the past 10 years, they are not doing a very good job of “manipulating zonal square miles both up and down, using the term "Habitat" to vary deer population surveys within CT.” Someone should tell them to get on the ball.
Doc is now explaining what we already know; showing less haditat will show a higher deer density per square mile.
Doc - " Now I don't know how DEEP determines what is deer habitat or not, but I do know it is not based on structures. For instance, Zone 11 was what, 291 square miles of deer habitat in 2015 as reported. If Zone 11 is 625 square miles of land area, does that mean that 334 square miles or 53% is structures? I don't think so. "
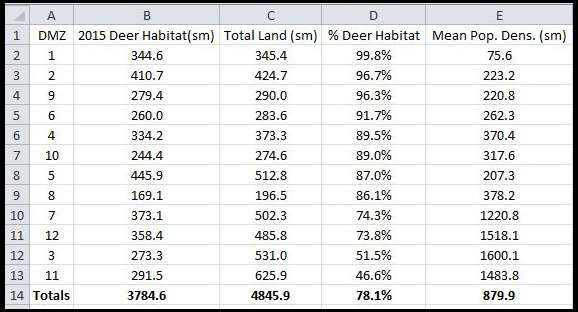
Why is the DEEP using the deer habitat figures of -53% in zone 11, -33% in zone 12, -23% in zone 7,- 20% in zone 4b and -14% in zone 8 ?
* Percentages shown are the difference between actual zonal square miles and DEEP square miles of habitat.
Example - Zone 11 - 625 square miles converted to 292 DEEP square miles of habitat = -53%.
Why is the DEEP using a deer habitat figures of -0.22% in zone 1, -2% in zone 10, -3% in zone 2, -4% in zone 9, -4% in zone 4a and -8% in zone 6 ?
* Percentages shown are the difference between actual zonal square miles and DEEP square miles of habitat.
Example - Zone 1 - 345.38 square miles converted to 344.59 DEEP square miles of habitat = -0.22%
Most States in the Country use deer per square mile or deer per acres when estimating deer populations and do not use " deer per square mile habitat "; we now see the reason why !


Dr. Williams's Link
As Mike said and he is right, that we can look at deer harvest per land area of each zone. But it doesn’t really paint an accurate picture for all the reasons mentioned already. Remember the “concrete jungle?” A more meaningful depiction of harvest density is to look at harvest density on lands on which deer are being harvested, aka. “deer habitat” which doesn't include downtown Bridgeport, Stamford, Norwalk, etc. So we could also look at annual harvest density using the entire area of CT including water (5,543 square miles), the land area of CT (4,845 square miles), or we could look at deer harvest density from where the deer were actually harvested (3,785 square miles). I think we all know which figure is most accurate, but then again, conflicts with your mantra that there are no deer left in Zone 11, therefore, it’s a DEEP conspiracy to inflate deer abundance.
If anyone actually cares about CT’s changing landscape, UConn CLEAR (Center for Land Use Education and Research) has been tracking it for some time. Look in the link for great maps, data, land cover, impervious surfaces, and all of their changes over time. This is by watershed basin and not by deer hunting zone, which is probably why DEEP has not updated it deer habitat in 10 years. Go here: http://www.clear.uconn.edu/projects/landscapeLIS/summary/index.htm and look at the basin changes from 1985 to 2010. I know they are not DMZs, but you can get a picture what is going on throughout different areas of the state. It is data like these DEEP uses to make the deer habitat determination.
Back to regularly scheduled deer population discussion.


Only when one parameter, land, by shifting this metric to "habitat" do the numbers shift when determining deer taken/unit of measure. It should be easily apparent what decreasing the unit of measure (land to habitat) does to the number of deer taken per that unit of measure; it increases, and it increases substantially. If one's goal was to promote the need for unlimited doe tags, baiting and January hunting this would certainly meet that goal.